Kill the Build Process: Introducing Dashboard Mode for Exmergo Viz
Stop wrestling with complex menus. Introducing Dashboard Mode by Exmergo: turn a single prompt into a full data dashboard instantly.
Marco Ciavarella
Co-Founder & CEO
Building a dashboard shouldn’t take 7 meetings, 3 weeks of data prep, and a major headache.
If you work in data or rely on it to make decisions, you know the drill. You have a critical business question, but the answers are trapped behind complex menus, endless formatting tweaks, and clunky drag-and-drop interfaces.
What if you could skip all of that? What if getting a dashboard took just one prompt?
We are thrilled to introduce Dashboard Mode in Exmergo Viz.
We Listened to Our Users
At Exmergo, we are building the future of data analytics through AI Agents. But the best product roadmaps aren’t built in a vacuum — they are built by listening. And our great users tell us exactly what they want.
In our conversations with the community, a clear pattern emerged. We noticed that the goal of our users was never “building a dashboard.” The goal was always “getting the answers.”
The building part was just getting in the way.
Users didn’t want an easier drag-and-drop builder. They wanted NO drag-and-drop builder. So, we decided to kill the building process entirely. We worked side-by-side with our users to create something completely frictionless.
Meet Your Dashboard AI Agent
With Dashboard Mode, Viz (our Dashboard AI Agent) handles the heavy lifting. There are no menus, no formatting, and crucially: no waiting for weeks on end.
We’ve reduced the entire analytics workflow into a simple, 2-step process.
Step 1: Ask a Question, Get a Dashboard
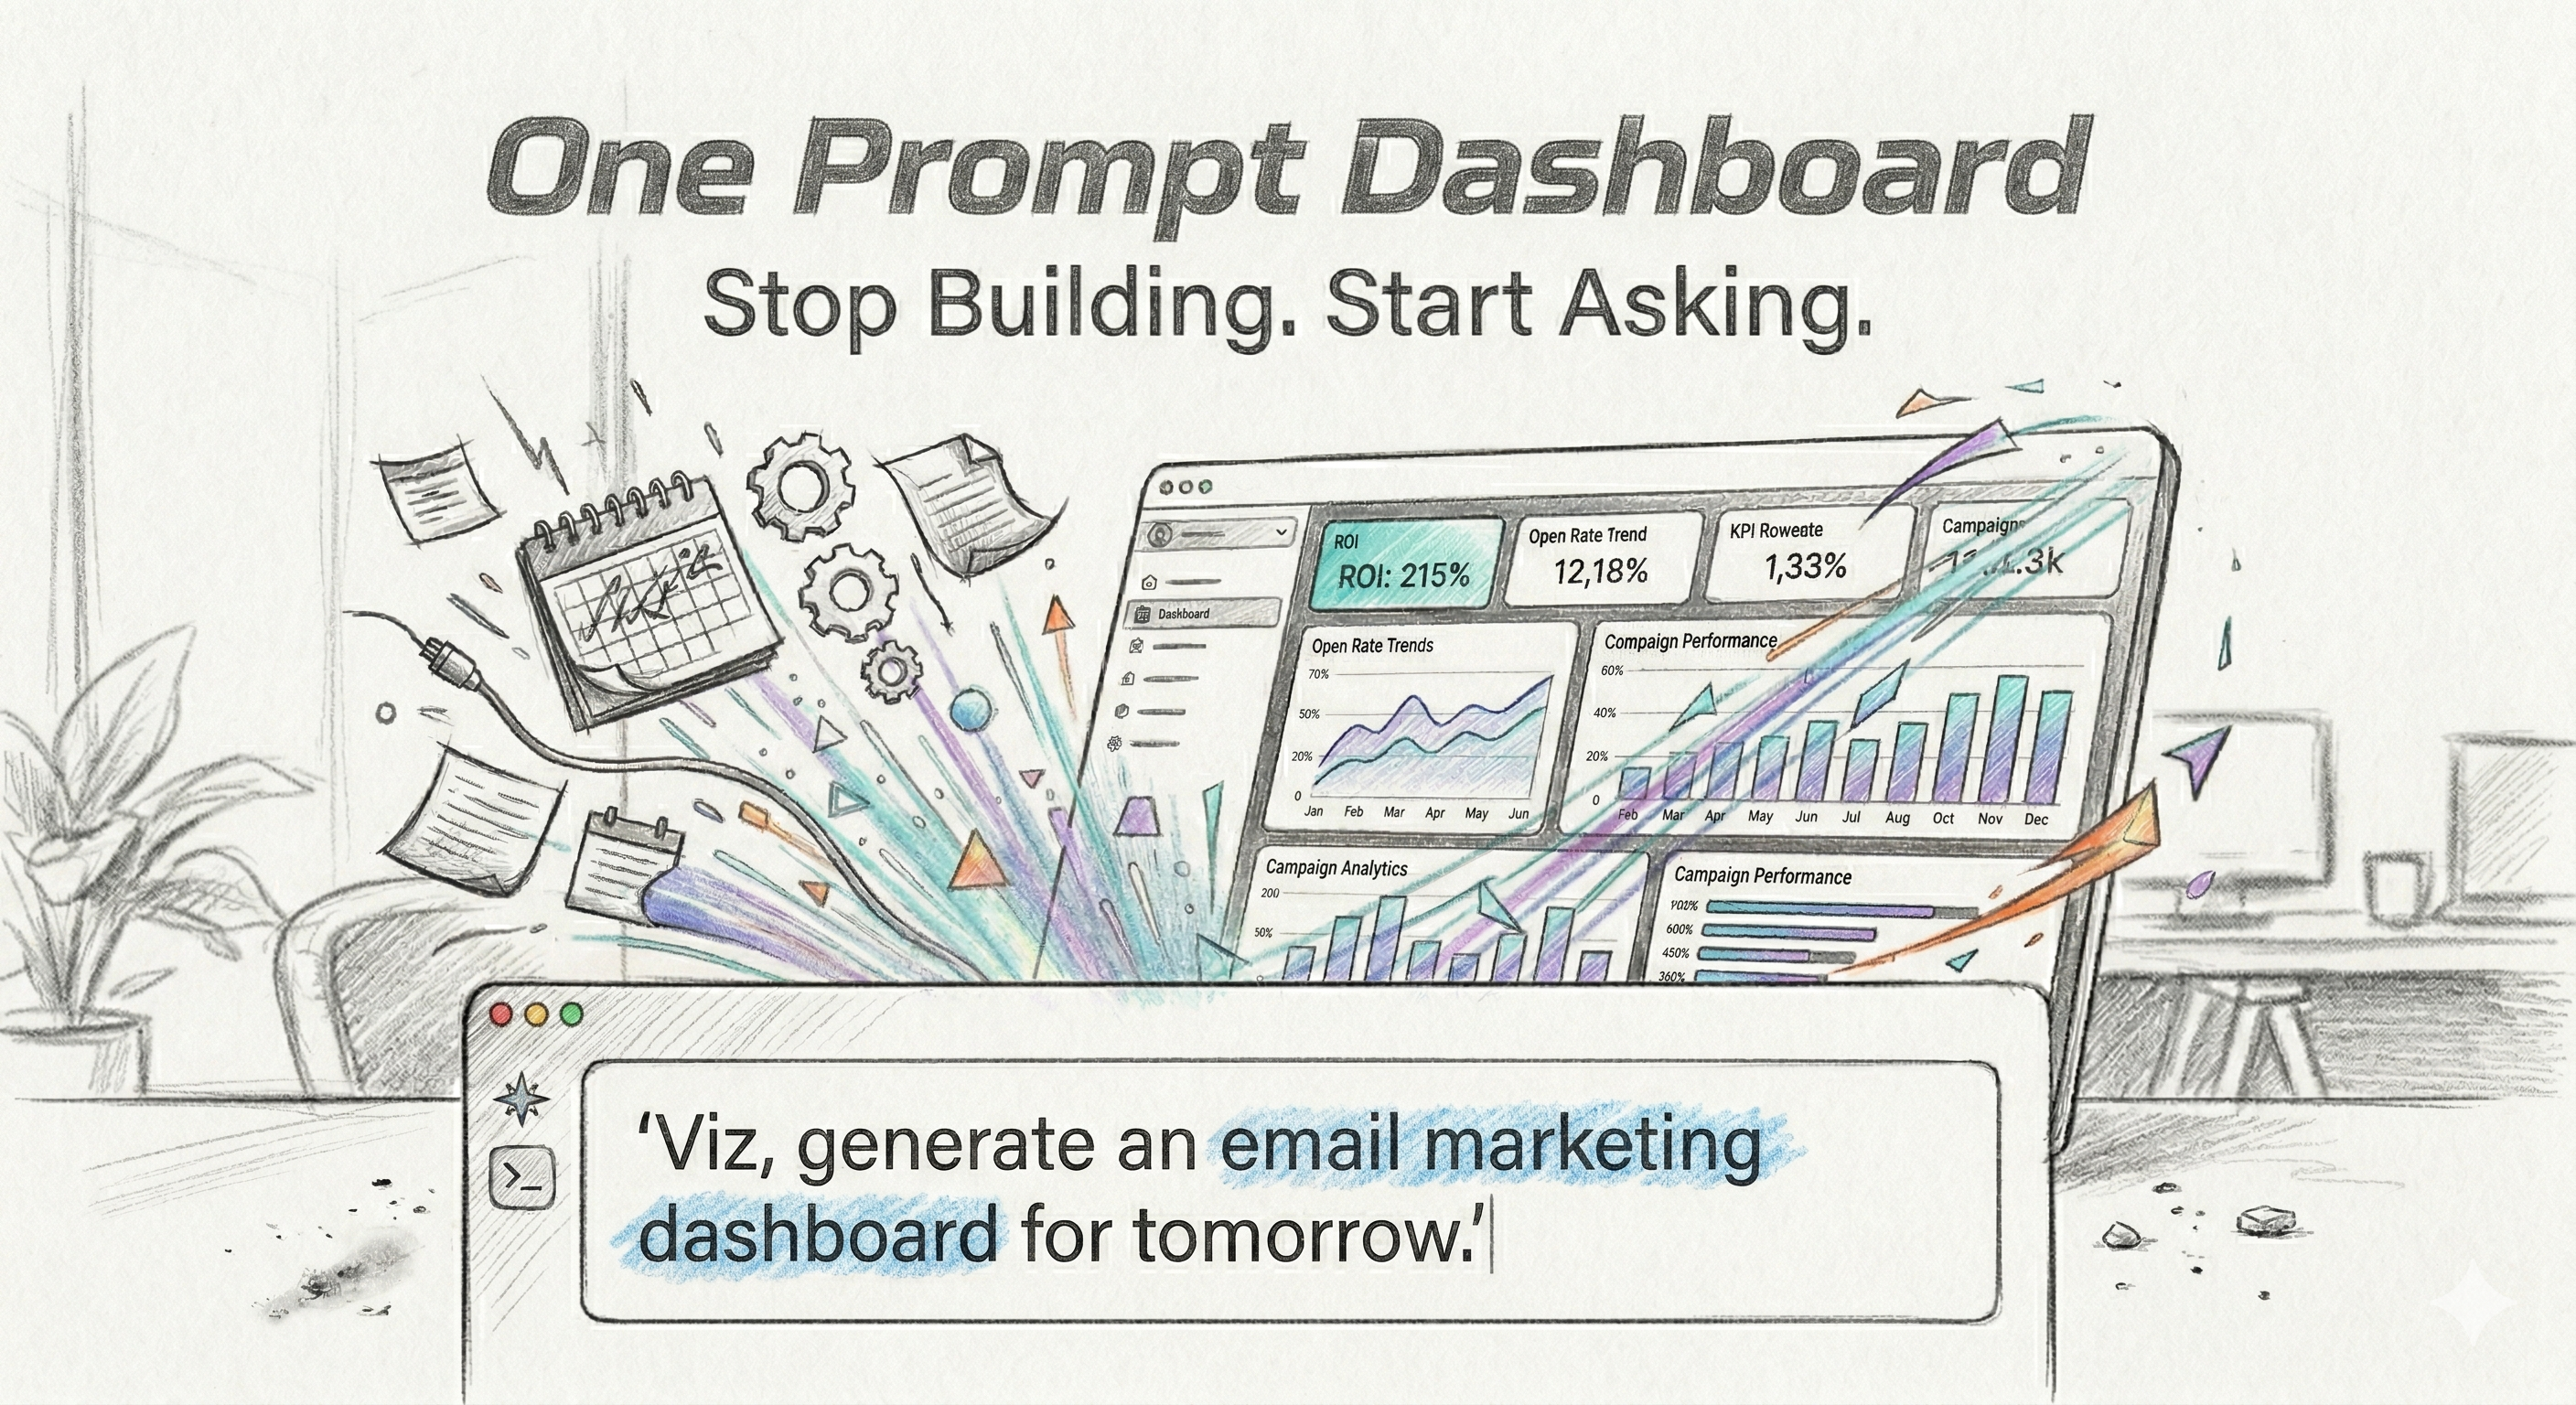
Instead of connecting nodes or dragging charts onto a canvas, you just talk to Viz. You tell your AI Agent exactly what you need in plain English.
- You type: “Viz, I really REALLY need a great dashboard showing our email marketing campaign to my team by tomorrow.”
- Viz goes to work: Boom. Dashboard generated.
Viz instantly understands the context of your request, pulls the right metrics, selects the best visualizations, and generates a comprehensive, beautiful dashboard on the spot.
Step 2: Relax (or Build Another Dashboard)
This is what “flow state” is all about. With the hours — or days — you just saved, you can actually focus on analyzing the data, making decisions, and moving your business forward. Or, you can just sit back and enjoy the extra time.
Stop Building. Start Asking.
Dashboard Mode is officially live and available for all users. A massive thank you to every user who hopped on a feedback call, sent an email, or submitted a feature request to help us refine this. We built this for you.
Ready to get into a flow state with your data?
References
https://exmergo.com/why-exmergo-viz